Starting in version 1.1.0 of the Powerline QRM monitor, one of the side-effects of the new live pulse tracking capability has been the indirect measurement of the power utility frequency. It’s almost never exactly 60 Hz, and one kind of fascinating fun fact is that the entire west coast power grid generally marches in lockstep (because it has to)- if the frequency is 59.99 Hz in Seattle it’s exactly the same 59.99 Hz in Los Angeles… which means it’s also 59.99 Hz in San Mateo where my station resides.
At a recent club meeting, another ham told me about a cool site, kestrelgrid.com, which is continually monitoring the frequency of the power grid in many locations around the world, including the west coast of the US.
So I thought it might be fun to take my station’s frequency estimates and produce a new chart to see if or how well they align with KestrelGrid’s direct measurements of power frequency. My station only logs a frequency estimate when it has a lock on noise from PG&E, but as they’ve been making noise almost the entire day of late, I have plenty of data. First, take a look at KestrelGrid’s chart for today:
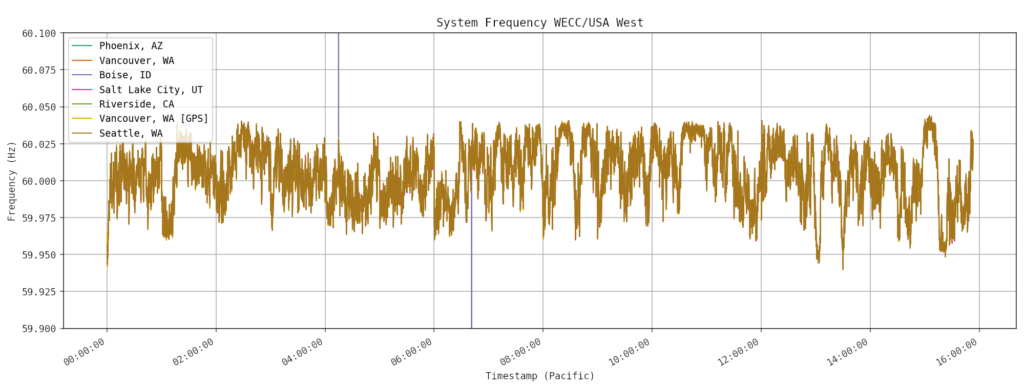
Pretty chaotic, as you can see, but note the scale on the left. The graph mostly lies between 59.950 and 60.050 Hz, really only deviating by 0.05 Hz, a small but measurable amount. Now look at my chart, produced from estimates that came from received noise on the 80m band from PG&E’s faulty equipment:
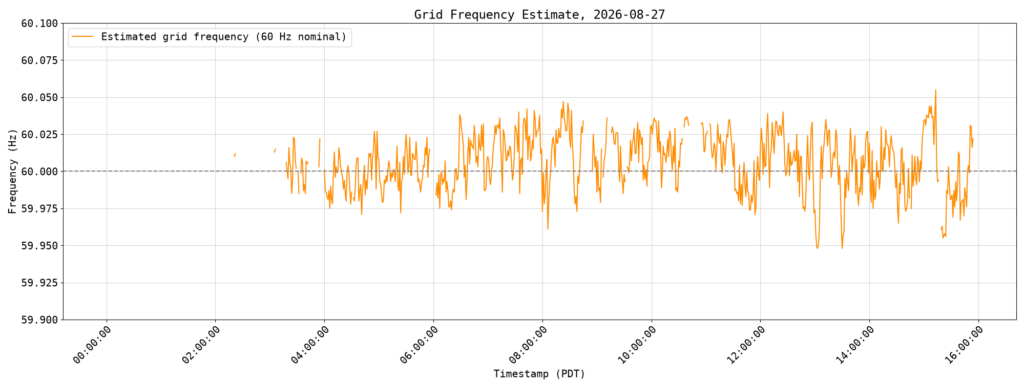
The gaps are there because when PG&E is not producing noise, I have nothing to use as a basis for measurement. Now take a look at my chart overlaid atop KestrelGrid’s:
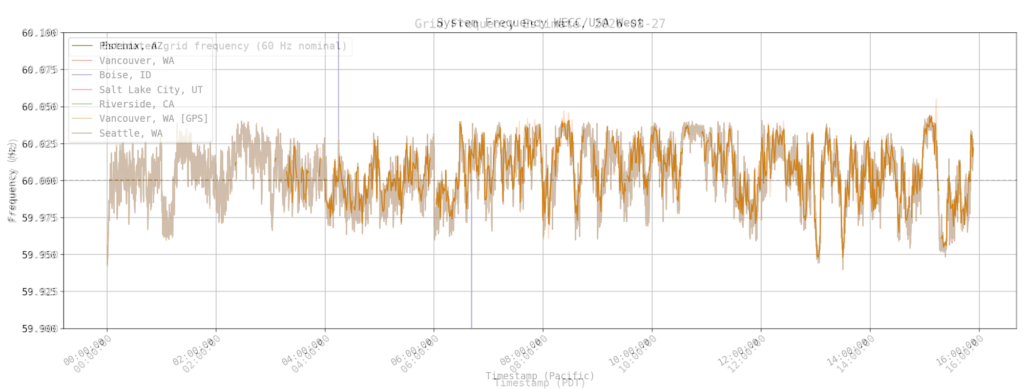
This is what measurement agreement looks like. Note that my monitor is only storing the sampled data about once per minute, whereas KestrelGrid is charting two samples per second, so there is bound to be some deviation. But how closely these charts agree is truly striking.
This convincingly shows two things: my methodology of live pulse tracking and using phase adjustments to stay in sync, then deriving power frequency from the phase adjustments is sound; and, whatever is making all this noise is almost certainly connected to the west coast power grid.
Of course almost everything that’s plugged in anywhere around me is connected to the west coast power grid, so the monitor by itself cannot definitively say whether a noise source is failing or faulty PG&E equipment. That’s beyond the capabilities of most any stationary monitor. To determine the actual source of a noise, it’s always necessary to go outdoors and triangulate using directional antennas. (Which I have, of course, done many, many, many times.)