November Six Oscar Lima

Tag: interference (Page 3 of 3)

Graphing Powerline Noise

As part of my effort to help to track down and, ultimately, have the powerline noise in my neighborhood eliminated, I felt it was necessary to collect a lot more data about the problem, especially to help predict when the noise would be most audible so PG&E technicians would stand a better chance of being able to find the source of the problem.  (To date, however, they’ve done exactly nothing.)

To that end, I did what I do best: I wrote some code. It turns out to be straightforward in Python to sample audio off a sound card, produce graphs, and upload them with sftp to a web server.  The problem of pulse detection was a fun one.  My initial approach was to use Fast Fourier Transforms (from the NumPy module) in an effort to look for a 120Hz signal and its harmonics.  This approach, however, was ill-suited to the problem. The noise PG&E is making comes in very brief pulses, lasting only 3-5ms, maybe a total of 24-48 samples from beginning to end at 16000 samples-per-second.  It turns out this isn’t great for analysis with FFT.

I decided to take a different approach and run my analysis in the time domain instead of the frequency domain.  Because what I am looking for is a very predictable and highly consistent exactly 120 pulses per second, it’s possible to create an array of coefficients with 1’s spaced exactly 1/120s apart and 0’s everywhere else.  Then this array can be “slid” along the sample array, multiplying the arrays together and summing them for each point.  Where the sum is the largest, the alignment is optimized for a repeating pulse at 120pps (because that’s where the most 1s lined up perfectly with the pulses).  I also found this method produced even better results with multiple 1’s in sequence; I therefore use a sequence of three 1’s.

Once the best alignment with 120pps can be found, it’s a simple matter to backtrack to the beginning of the sampled audio and run the same analysis again from that point to arrive at a raw sum of the sample amplitude.  Finding the noise floor is a similar operation.  I take a little bit of a shortcut here and analyze the audio exactly midway between the 120pps peaks.  This is an approximation, of course, and it has one significant limitation: the pulses have such a high relative amplitude that they de-sense the receiver to a small extent.  This has the effect of making a pulse with a high amplitude cause the noise floor to appear to be somewhat lower than it really is.  Another limitation is that a high noise floor can cause the amplitude of the 120pps signal to appear higher; I believe this is because it isn’t truly possible to completely discern a signal from noise; at every point along the time domain input, what we’re actually seeing is a sum of the signal and the noise.  To put it another way, the noise doesn’t stop being there just because there’s a signal present.  So the “signal” level is really a sum of the signal and the noise floor.

Luckily, for the most part, the noise floor is relatively steady and changes slowly over time.  That is, until there’s a solar flare:

Something notable happened to the noise floor just before 6 AM Pacific on April 22 and caused quite a ruckus for the remainder of the day. I happened to notice on Mastodon from the Solar Flare Alert bot reports of significant solar flares right around the time the noise floor went crazy.  It’s a fascinating result that I wasn’t expecting when I started on this project.

In this graph you can also see how the signal and noise levels affect each other to some extent, but the key important thing is noting when the signal (the 120pps noise) level exceeds the arbitrary threshold I chose, -48dB.  Just by observation, this seems to be about the level where the 120pps noise is significant enough to render the 80m band useless, and it also seems to be about the midpoint between “on” and “off”, which stands out a little bit better in this graph:

The symmetry in question stands out reasonably well in this chart, especially between about 5:30 AM and 8 AM.  One thing I’m hoping to find in the next several days or weeks of data is some pattern to when the noise is most likely to be present, in the hope that I can give PG&E’s technicians some idea of when they should come out looking for a problem.

The data is sampled once a minute, and the graph and the signal, noise, and SNR data along with some current weather conditions are recorded in a CSV file; the plot is regenerated, and both are immediately (re)uploaded to the n6ol.us server.  Then it’s a simple matter of updating the filename once a day to build up a complete set of charts and recorded data segmented by day.  You can view the complete set of files at https://n6ol.us/noise/

Remaining is the challenge of getting PG&E to actually do something about the problem.  So far they’ve been ignoring it as hard as they can or denying that it’s even possible for them to generate RFI that affects shortwave radio (which is, of course, nonsense).


Another view of PG&E powerline noise

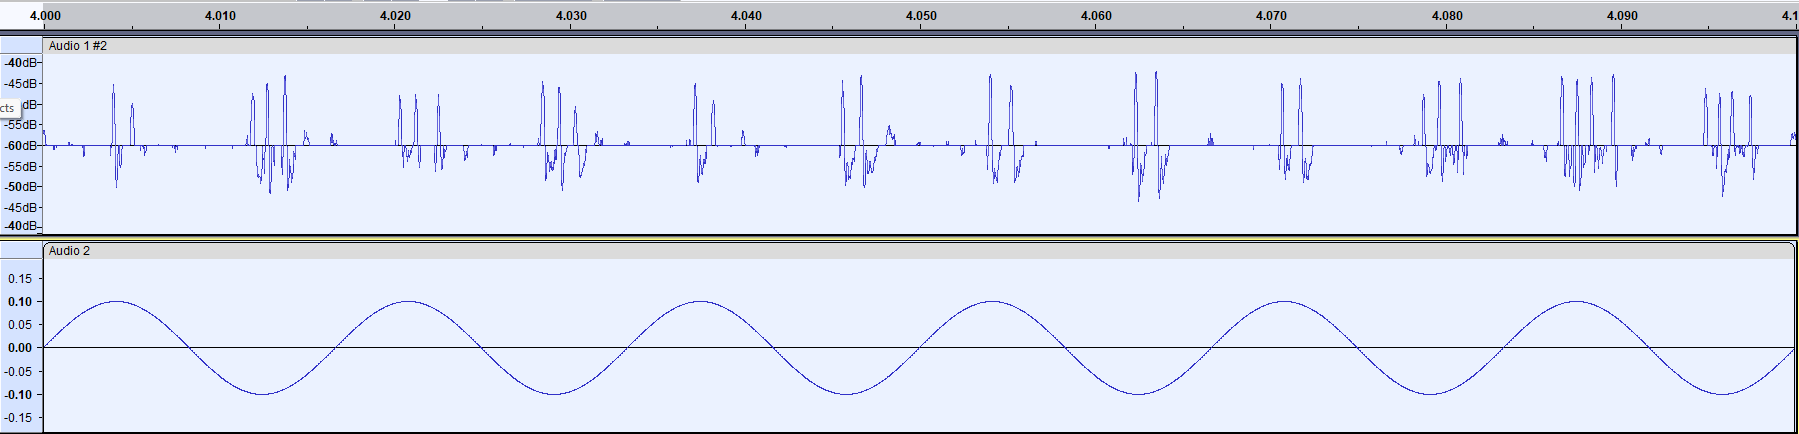
I finally had a moment to pull up the waveform of The Buzz– PG&E’s faulty equipment producing radio frequency interference (RFI) in my neighborhood– and overlay a 60Hz sine wave on top of it:

A 60Hz sine wave overlaid on sampled audio of PG&E powerline noise

As you can see, the bursts of noise align perfectly with a 60Hz sine wave.  It would be astonishing if this were not powerline noise.

I also found on the ARRL’s examples of utility noise page, under the heading “w4tdk-13690 Powerline Noise” is a noise that sounds very similar to mine.  From their description:

Torbjorn received excellent service from his local power utility. Power was turned off for several blocks around his QTH, and the noise was eventually isolated to a ground wire on pole-mounted lightning arrestors that had burned through in two places and were just barely making contact. The wire was repaired and the noise disappeared. The customer (W4TDK) is happy, and the power company fixes a potentially dangerous situation. Everyone wins!

Unfortunately, I have not received excellent service from my local power utility, PG&E.  They continue to ignore the problem, and just this morning they had a catastrophic failure of some piece of equipment (due to neglect, no doubt) on the other side of our neighborhood that cut power to about 900 customers.  One notable difference with W4TDK’s recording is that his noise comes in 60 pulses per second rather than 120; it’s only pulsing on one side of the sine wave; perhaps having a wire that’s just barely making contact was behaving a bit like a diode, sparking with current flowing in one direction, but not the other?

W4TDK's noise source with a 60Hz sine wave overlay

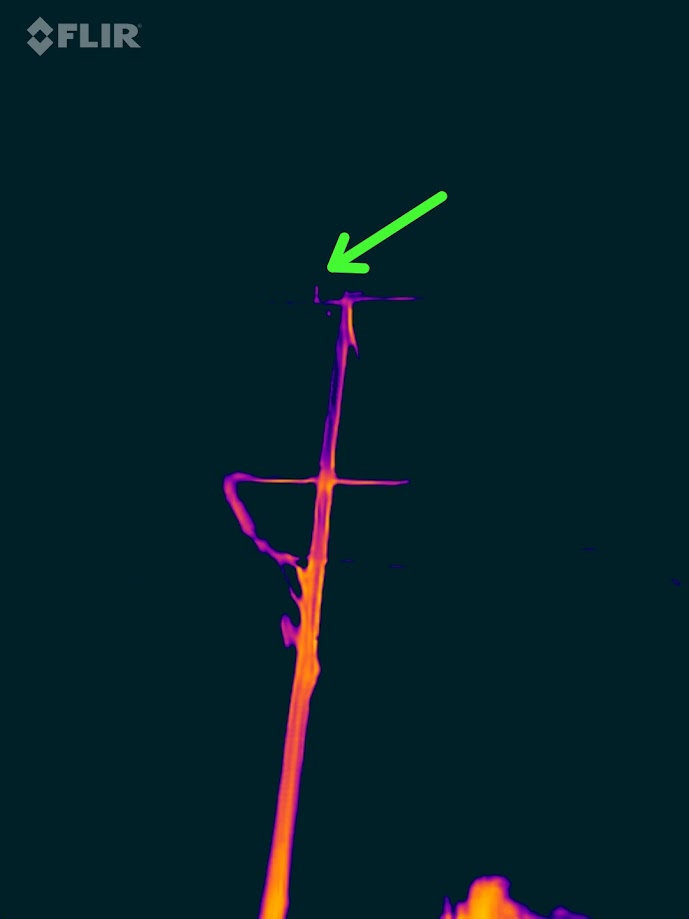
In my case, I suspect the problem is a faulty insulator, and I might have even located which one it is with my thermal camera.  I’m fairly sure my neighbors think I’m nuts, but I snapped this image last night while it was fairly cold outside, and I’d set the low end of the range of my FLIR camera high enough that most objects did not show up at all in infrared, except for a little heat given off by warm patches of road, houses, cars, trees, and this utility pole:

A thermal image of a utility pole with a green arrow pointing to a warm object at the top.

Note that this utility pole has a number of insulators on both the crossbar on the top and the middle.  You can’t see most of them because they’re just too cold.  So cold, in fact, that you can see a dark shadow cast by the two on the top right if you look carefully.  But on the top left, at the end of the green arrow, one insulator is just warm enough to be visible.

Now it’s certainly inconclusive, and in no way is this proof of a faulty insulator, let alone the one that seems to be warm.  There are many reasons this particular insulator might be showing up while the others do not; it could be something else that happens to be reflecting off its surface from the position where I happened to be standing, or it could be that had I stood in a different position, a different insulator would have been visible, just an accident of optics and positioning.  It’s not impossible, though, that this insulator is faulty, and that it’s warm because there’s a current arcing across it 120 times per second for 1.5ms – 3.75ms each time (I don’t know why sometimes there’s just one quick pop, and sometimes a double pop which you can see in the waveform, other than perhaps just random chance).

Another observation is that ambient temperature and humidity may be a factor, possibly temperature more than humidity.  Above about 60 degrees Fahrenheit, The Buzz is much less prominent than it is at 60 degrees and below, but I do not have enough data to say this is more than a coincidence; it could as easily be the case that it’s a function of how much electricity is being consumed in my neighborhood, and people consume more when it’s colder outside.  Or it might not be a real pattern at all.

At any rate, the saga continues, and in a few days I’ll make my weekly call to PG&E to check on the status of my open ticket.  As of last week, nobody had even looked at it, 24 days after it was opened…


PG&E Powerline Noise in San Mateo

I recently began dabbling in Ham Radio again after having my radios turned off for a few years; the endless prattle of right-wing nutjob conspiracy theorists moaning on every band had become tiresome, solar conditions weren’t great, and I just had a lot of other things going on.  With the sun waking up again of late, and my husband insisting I spent some bonus money from work on something frivolous rather than something responsible, I got myself a shiny new Elecraft K4, a snazzy new antenna from HyPower Antennas, and got myself back on the air.

Things were going great for a few hours until The Buzz kicked in.  The Buzz is, as best I can tell, some piece of failing PG&E equipment, probably an insulator or lightning arrestor, which has become an inadvertent spark-gap transmitter.  It is somewhat intermittent, but almost always present in the late afternoon or early evening, and it generally persists well into the night.  Once it starts, it nearly blanks out everything from 160m through 6m.  It’s unclear what causes it to come and go, though there seems to be some correlation between moisture, temperature, and even wind.

Today after a few days of quite wet conditions followed by cold air at about 60% humidity, The Buzz was back with a vengeance.  A new variant today is that we’re having strong, gusty winds, apparently adding some modulation to The Buzz.  Here’s what it sounds like on 5MHz. I haven’t normalized the audio in this file; this is directly recorded off the K4.  The signal strength was around -70dB:

You can hear some subtle interruptions in The Buzz.  This is not coming from loose antenna connections.  I suspect somewhere a powerline or bit of cabling is getting tossed around in the wind, and this in turn is introducing that modulation to the signal.

To prove it wasn’t just a bad connection on my antenna, and my antenna swinging around in the wind instead, I tuned to 15 MHz so I could try to listen to WWV along with The Buzz.  In this recording, you can hear how the intermittent nature of The Buzz happens independently of the WWV signal; The Buzz comes and goes, but WWV stays more or less consistent throughout (though it can be a little hard to hear when The Buzz is in full force):


Here you can see exactly 12 pulses in 0.1 seconds, which equates to 120 pulses in 1 second.

A visualization of the waveform produced by PG&E's powerline noise showing 12 pulses in 0.1s.

Recall that the frequency of a sine wave- like that used in 60Hz utility power- refers to the time it takes to complete one full cycle, which includes both the positive and negative peaks.  Thus, a 60 Hz wave while completing 60 cycles per second completes 120 peaks (and 120 zero crossings) per second.  My suspicion is that PG&E has a faulty insulator somewhere and the arcing is happening across the insulator, between one phase and neutral or ground.  Once the voltage reaches a high enough positive value, it begins to arc until the voltage comes down enough that the insulator is sufficient.  Then the power crosses through 0 volts, and when it reaches a high enough (absolute) value, it again arcs until the (absolute) voltage comes back enough again.  Then the process repeats.  If we overlay a sine wave we can actually see what’s happening:

PG&E Powerline Noise Pulses shown next to a 60Hz sine wave

My alignment of my generated 60Hz sine wave to the recording isn’t perfect (Audacity on my ham radio PC is kind of a pain to work with), but you can see pretty effectively how each peak and trough of a 60Hz sine wave lines up with a burst of powerline noise.  Given the highly predictable nature of the offending transmission, if we knew the RMS voltage of the source, we could probably even calculate the breakdown voltage at which the insulator is failing to prevent an arc.

Given the age of the infrastructure in my neighborhood — there are even still glass insulators on many of the utility poles here– it’s not exactly surprising that there would be some old equipment starting to break down.  Indeed, in the two years prior to this year, we experienced lengthy power outages after insulators saturated with rain exploded, sending powerlines into trees and leaving crossbars smoldering.

With PG&E’s reputation of incinerating neighborhoods and even entire towns, you might think they’d be a little more interested than they are in taking preventative measures, especially when given the opportunity to fix a problem while it’s still just generating RFI but not yet fire.  Sadly, this does not seem to be the case.  I’ve contacted them (so far) on March 12, 20, 28, and April 5, for updates on my original case and to date, nobody has even looked at it, let alone gotten back to me.  I am, of course, documenting everything, and after 60 days, I will make this an FCC RFI complaint, at which point I’m sure the FCC will remind PG&E once again that they are obligated to fix these problems, as they have had to do many times in the past.


Newer posts »

© 2026 N6OL

Theme by Anders Noren — Up ↑