N6OL

November Six Oscar Lima

Tracking Power Utility Frequency via Noise

Starting in version 1.1.0 of the Powerline QRM monitor, one of the side-effects of the new live pulse tracking capability has been the indirect measurement of the power utility frequency. It’s almost never exactly 60 Hz, and one kind of fascinating fun fact is that the entire west coast power grid generally marches in lockstep (because it has to)- if the frequency is 59.99 Hz in Seattle it’s exactly the same 59.99 Hz in Los Angeles… which means it’s also 59.99 Hz in San Mateo where my station resides.

At a recent club meeting, another ham told me about a cool site, kestrelgrid.com, which is continually monitoring the frequency of the power grid in many locations around the world, including the west coast of the US.

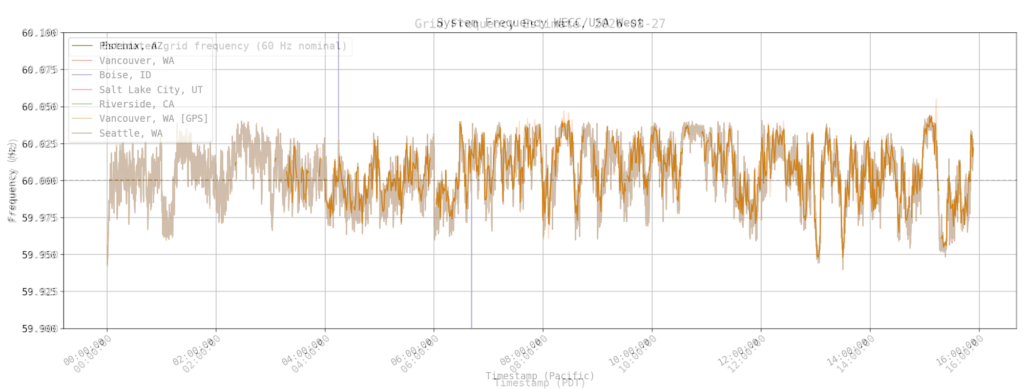
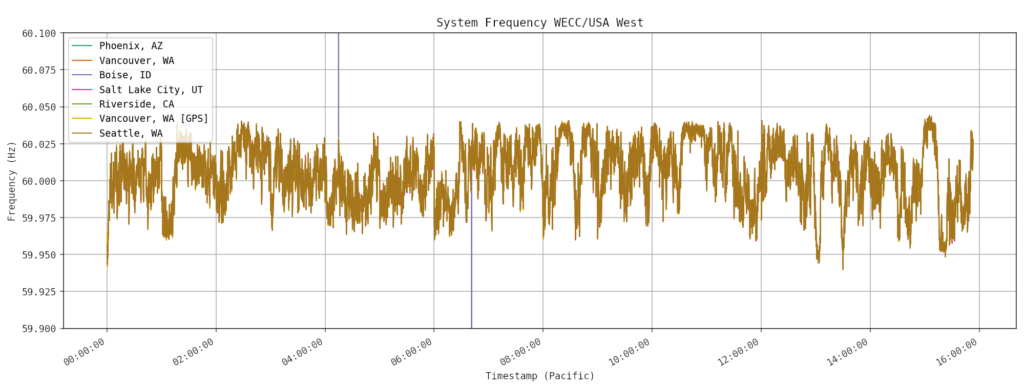
So I thought it might be fun to take my station’s frequency estimates and produce a new chart to see if or how well they align with KestrelGrid’s direct measurements of power frequency. My station only logs a frequency estimate when it has a lock on noise from PG&E, but as they’ve been making noise almost the entire day of late, I have plenty of data. First, take a look at KestrelGrid’s chart for today:

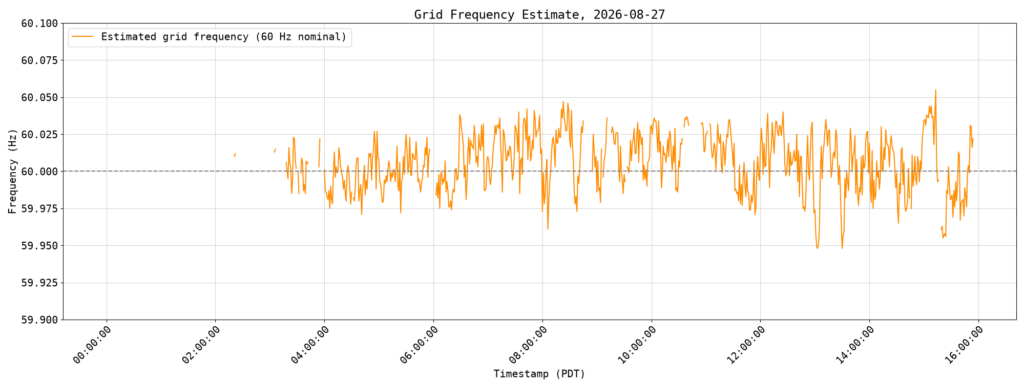
Pretty chaotic, as you can see, but note the scale on the left. The graph mostly lies between 59.950 and 60.050 Hz, really only deviating by 0.05 Hz, a small but measurable amount. Now look at my chart, produced from estimates that came from received noise on the 80m band from PG&E’s faulty equipment:

The gaps are there because when PG&E is not producing noise, I have nothing to use as a basis for measurement. Now take a look at my chart overlaid atop KestrelGrid’s:

This is what measurement agreement looks like. Note that my monitor is only storing the sampled data about once per minute, whereas KestrelGrid is charting two samples per second, so there is bound to be some deviation. But how closely these charts agree is truly striking.

This convincingly shows two things: my methodology of live pulse tracking and using phase adjustments to stay in sync, then deriving power frequency from the phase adjustments is sound; and, whatever is making all this noise is almost certainly connected to the west coast power grid.

Of course almost everything that’s plugged in anywhere around me is connected to the west coast power grid, so the monitor by itself cannot definitively say whether a noise source is failing or faulty PG&E equipment. That’s beyond the capabilities of most any stationary monitor. To determine the actual source of a noise, it’s always necessary to go outdoors and triangulate using directional antennas. (Which I have, of course, done many, many, many times.)

PG&E RFI Case Referred to the FCC

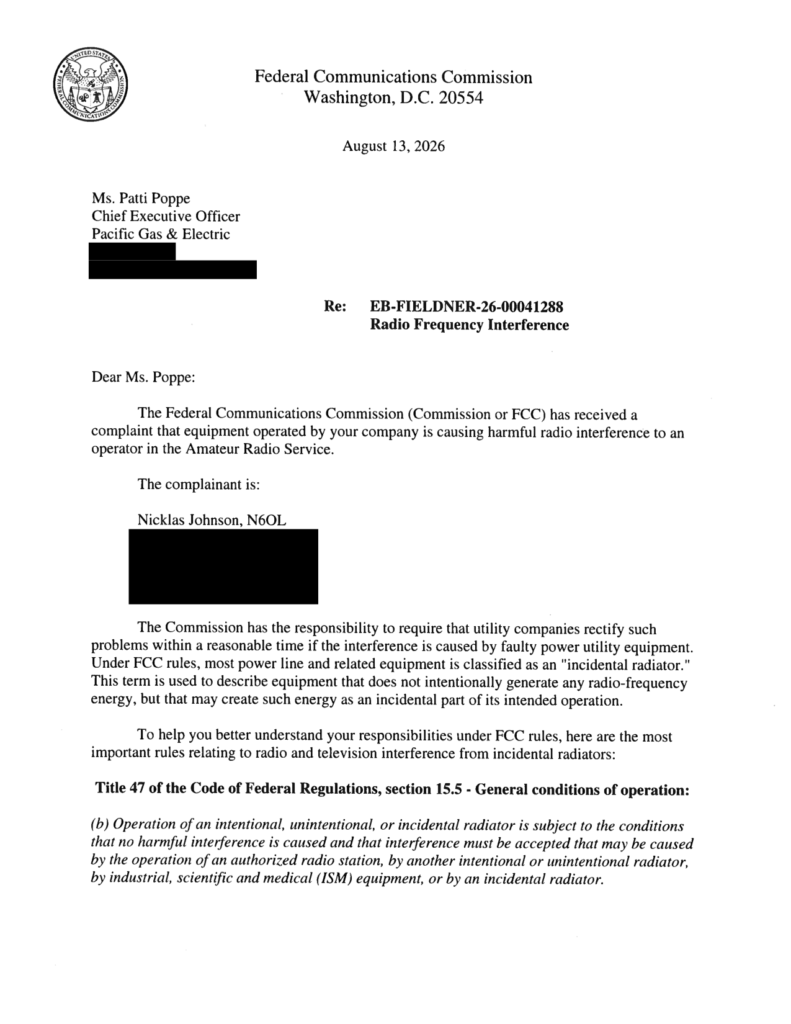
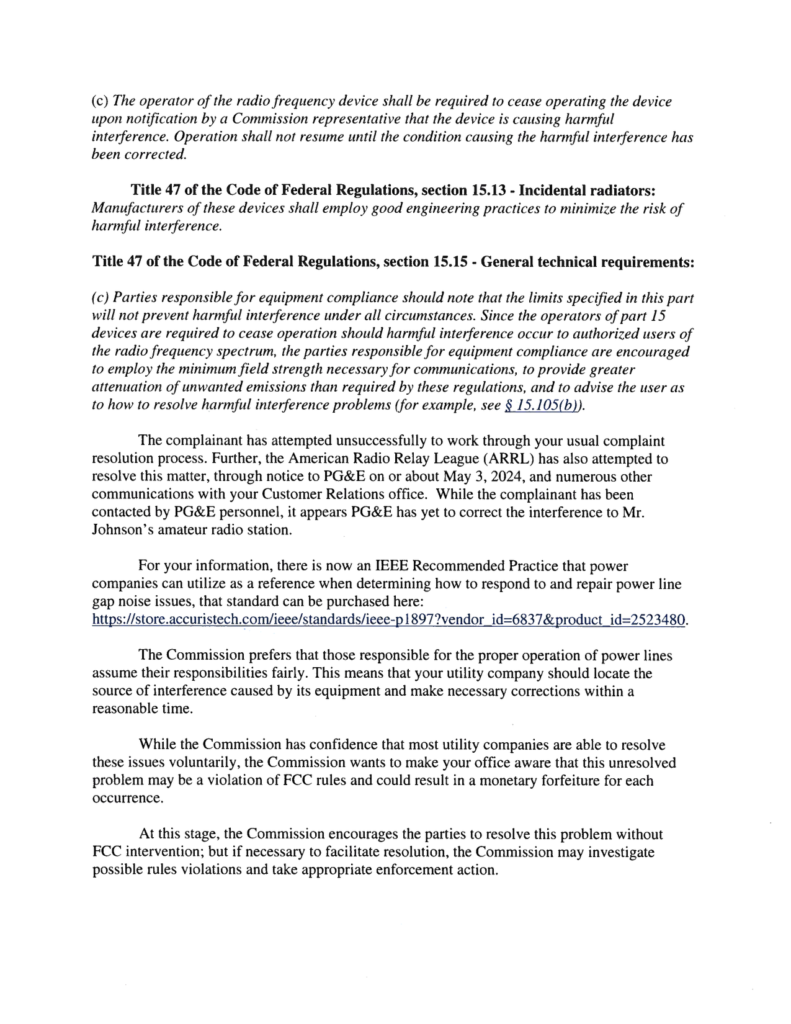
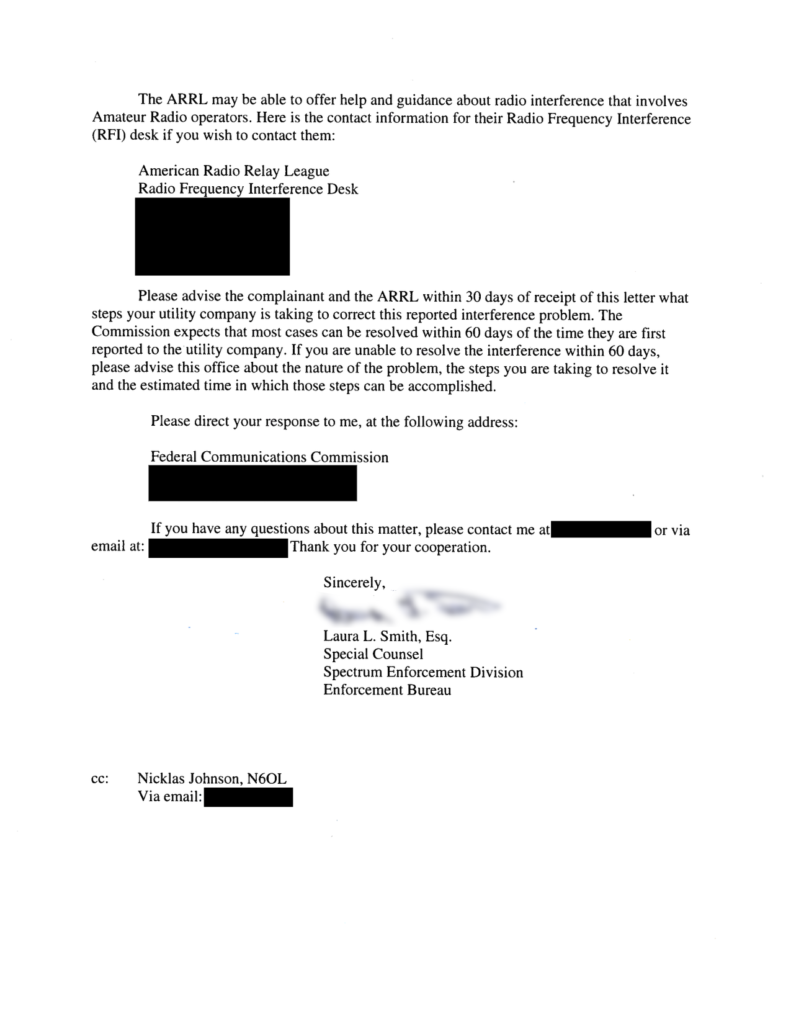
I waited to post this until I was sure there was enough time for the letter to arrive and be to processed by PG&E first.  Addresses and phone numbers have been redacted.  After more than two years of trying to get PG&E to cooperate and to fix their faulty equipment in my neighborhood, my case has been referred to the FCC, which in turn has sent them a notice via postal mail (click the thumbnails to view the full-size image):

My favorite part can be found on page 2, which reads:

The complainant has attempted unsuccessfully to work through your usual complaint resolution process. Further, the American Radio Relay League (ARRL) has also attempted to resolve this matter, through notice to PG&E on or about May 3, 2024, and numerous other communications with your Customer Relations office. While the complainant has been contacted by PG&E personnel, it appears PG&E has yet to correct the interference to Mr. Johnson’s amateur radio station.

[emphasis mine]

Yes, we’ve been trying for more than two years to get PG&E to resolve this problem.  I could understand it if it took them a few visits to confirm the locations of the offending poles, but that’s an interval that should be measured in weeks, not years.  Taking years to resolve a straightforward problem just smacks of a desire not to cooperate for reasons one can only guess at.

And it’s not like we haven’t provided them data. They have the same access to my noise monitoring charts as the rest of the Internet. I’ve sent videos of my direction-finding exercises. I’ve shared my direction-finding log with them. They’ve chosen to do nothing.

I think if I were operating an electrical utility, and someone told me that I had specific pieces of equipment producing arc noise on RF, I would want to fix it, in case it was an early warning sign of an impending failure, but PG&E just doesn’t give any indication of seeing it that way.

N6OL Powerline QRM Monitor 1.5.3 Released

Version 1.5.3 of the Powerline QRM Monitor has been released.

This change primarily resolves a few nagging problems with web site publishing.  Notably, the page now refreshes only the chart using JavaScript, and several display bugs for mobile and other small screens have been resolved.

Additionally, a new script has been added to take everything in your recordings directory and render all of it as video.  It’s something I needed when I was looking for a specific behavioral example, and I figured other people might get some good out of it as well.

Lastly, the “all-time” chart is now disabled by default, but you can re-enable it in the configuration.  Mine went back 2+ years, and it just isn’t that useful to try to find trends in a chaotic system going back that far, especially when what you’re usually trying to do is show an electrical utility something which has been happening recently.  You can re-enable it in the configuration if you really want it, and you can still specify how far back to go in the “all-time” chart by specifying the earliest date-time in ISO format.  The 30-day and 7-day charts are unaffected and are always on.

This is likely the last maintenance release before the next big feature addition, RTLSDR support.  I expect that will be kind of a big deal.

N6OL Powerline QRM Monitor 1.5.2 Released

Just some small, but worthwhile changes in this release:

  • The divisions in the scope display are now based on the frequency of the utility power.  For 60 Hz, they’re 2.78ms apart, 3 phases of 120 impulses per second.
  • A bit of awkward UI in the setup/configuration tool has been cleaned up.

Enjoy!


N6OL Powerline QRM Monitor 1.5.1 Released

Just a minor release this time: I’ve reorganized the documentation into Diátaxis format, and junked most everything that Claude “wrote” in the README that it had “written.”

LLMs are halfway decent at very closely guided code generation and refactoring, but they’re absolutely horrendous at producing prose that any human wants to read.

Consequently I’ve written everything that actual humans might want to read myself, by hand.  (It feels weird to have to say something like that.  Five years ago, someone might ask, “how else would you write it?”)

Latest releases are always available at https://github.com/spatula75/n6ol-powerline-qrm-monitor/


N6OL Powerline QRM Monitor 1.5.0 Now Available

The N6OL Powerline QRM Monitor has certainly been learning some new tricks of late.   I started this project back in 2024 when I first started dealing with QRM produced by our electrical utility, PG&E, in the hope that if I could find some pattern to when the intermittent noise was present, it might help their techs know when to look, and by extension, help me to be rid of this QRM.  I certainly didn’t suspect at the time that I would still be dealing with this more than two years later.

In its original incarnation, the monitor ran completely headless, woke up once per minute, read some noise off the sound card, ran a cross-correlation analysis against the noise, estimated the intensity of the noise, the noise floor, grabbed some weather data off my personal weather station, and then updated a CSV log file and a set of graphical charts on my web site.  It ran this way for two years.  I have mountains of data!

This year, after being cajoled by a coworker and fellow ham into volunteering to give a talk at Pacificon 2026, I thought it might be nice to clean up the monitor code, make the code less embarrassing (it was originally meant to be a hack that I figured I’d throw away in a few months), and enable other people to get some use out of it.

I’m pleased to say that not only can others get some use out of it now, I am starting to get some fun and exciting new uses out of it as well.

For new users, there is now a setup program to create your Python virtual environment, download all your dependencies, and get the basics configured: audio device, level calibration, call sign, weather source, publishing location, etc.  This saves a lot of time and potential for error and just makes it easier to get started.  I’m also working on some written guides to help walk people through what the different options mean and why they’re there.

The code has been considerably refactored to have a continuous audio pipeline with a ring buffer, which feeds both an analysis pipeline, continuous waterfall, and oscilloscope simulation when not running in headless mode.  Because the audio pipeline is now continuous, and the signal we’re looking for is so predictable and periodic in nature, a lot of that expensive cross-correlation can be avoided; instead, the analysis pipeline looks a little to the left and a little to the right of where the peaks are predicted to be to see if there’s a better match in one direction or another, indicative of the phase slipping a little.  Phase slippage can be tracked over time to estimate a frequency slip, and one fascinating consequence of this is that the frequency of our utility power can in fact be estimated by the QRM that the utility is producing!  That is now shown on-screen as well.  I was surprised to see just how much our utility power dances around, quite often between 59.99 and 60.01 Hz, but sometimes with even larger deviations.

Another valuable new feature is highly configurable auto-recording.  You can specify a minimum duration and a minimum dB threshold before recording starts, so you can avoid recording transient bursts.  You can also specify a maximum recording duration so your clips don’t last forever.  Additionally, if you don’t care to record every event, you can set a per-time-period (configurable) budget for how many recordings you want to make.  Then the monitor automatically produces .wav files in the directory you specify.

By far my favorite new feature is the ability to take a recorded .wav file and to render it directly to an mp4 file, as I’ve done with the file shown at the top of this post.  If you should ever need to show someone the real proof that you’re experiencing powerline QRM, this produces a valuable visual aid.

The next step is producing a lot of human-written, human-consumable documentation for everyone who isn’t me.  Though I’ve found Claude Code invaluable for producing tedious, boilerplate code that I would otherwise have to type out by hand, I find that the documentation it produces is rubbish, and this requires the finesse of a real human being who knows what to say and how to say it, rather than a large language model producing a giant wall of slop-text.  Stay tuned for that; I hope to have it ready well before Pacificon, but it will be a little bit slower to produce because I’m writing it by hand.

Built an NA6O Mag Loop Antenna

One of the struggles with RFI hunting using a Yagi antenna on UHF is that I’m monitoring noise on HF – typically on the 80 meter band.  The nature of powerline RFI, at least in my experience, is that the signal is stronger the lower you go in frequency, so there’s a lot more to receive on 80m than 70cm.  It’s not at all practical to walk around the neighborhood hunting QRM using an 80m Yagi of course, and a 70cm Yagi has the advantage of being an off-the-shelf product and very easy to carry.
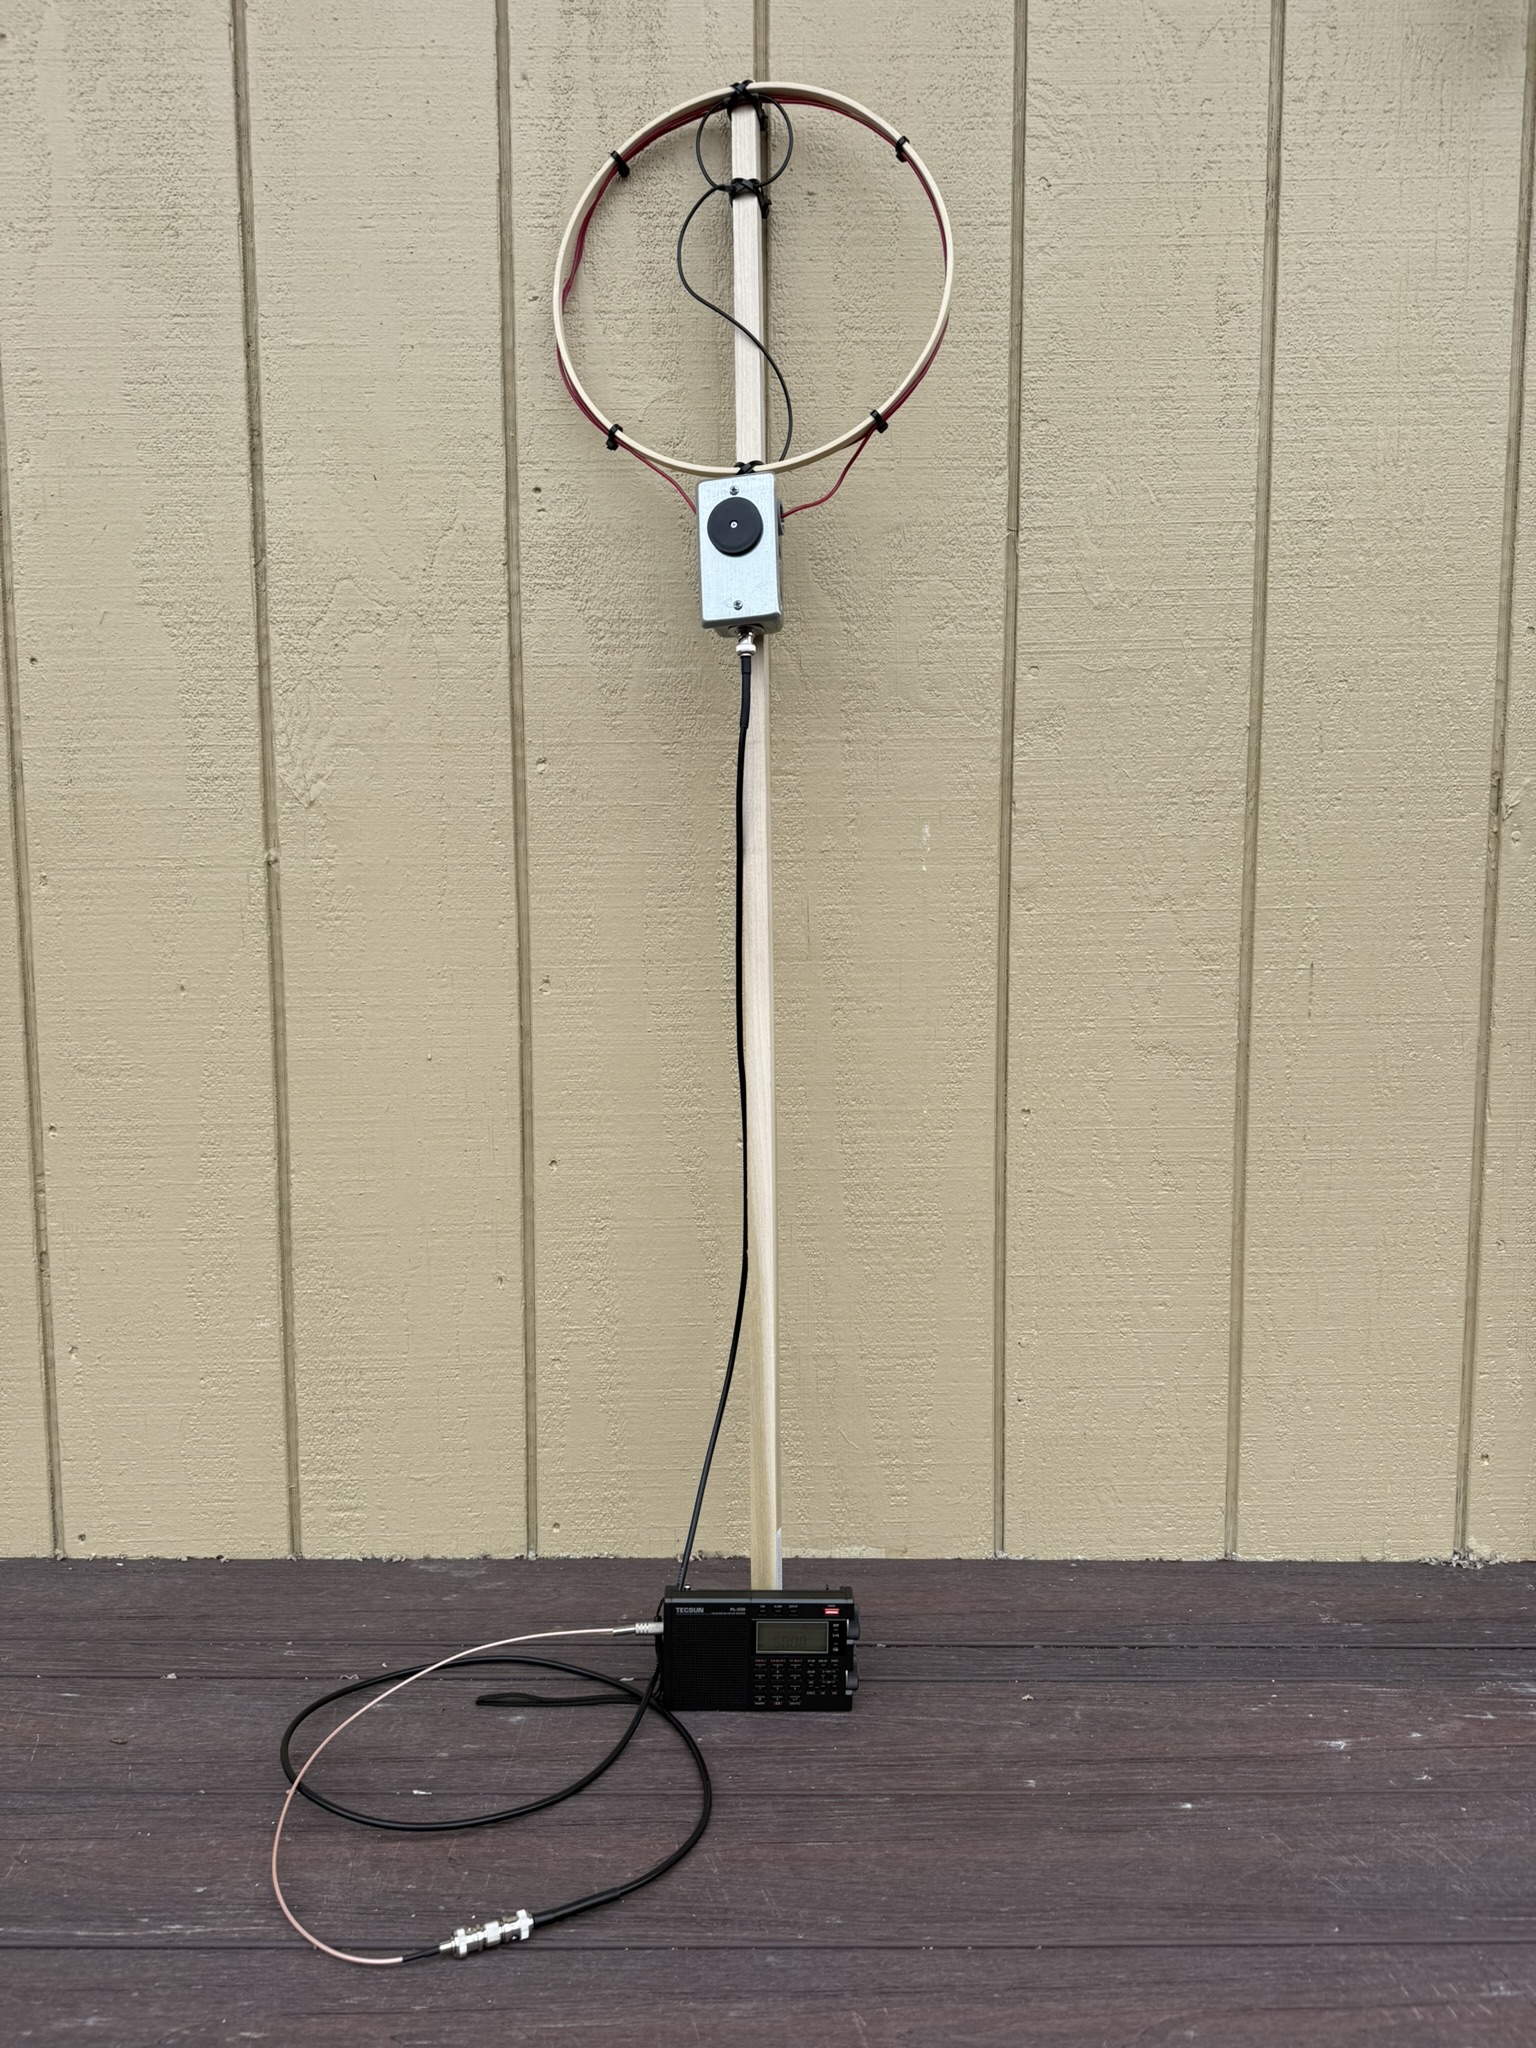
I came across the NA6O RFI DF Loop Antenna which helps to solve both the low-frequency hunting problem and the size problem in one swoop.  This is a receive-only antenna using a tuned magnetic loop with an inner Faraday coupling loop.  Magnetic loop antennas, as I’ve learned, have a very deep, very narrow null in their reception pattern.   When you’re edge-on to the source, it’s at its greatest intensity, and when you’re flat across it (ie, looking through the loop), you’re in the extremely narrow null.  As you might guess, a very deep, very narrow null is perfect for direction finding.  You just turn the antenna until you hear basically nothing, and then you’re looking through the loop either at the source, or at something 180 degrees away from the source.  As always, you need more than one bearing to get a location.  It’s a little bit more complicated than using a Yagi, because 0 degrees and 180 degrees are equal in intensity, but the process of triangulation is very similar- you just need to be mindful that your source may lie anywhere in the direction your loop is facing, both in front of you and behind you.

I don’t have a very well-stocked junk box, so I sourced some stacked Polyvaricon variable capacitors on Amazon (no financial interest) for the tuning.  I did have a 220pF capacitor in my junk box, and I soldered one leg across the two stators, and the other leg to the rotor.  This gave me an effective range of about 280 – 820 pF.  By the chart in the NA6O doc, this should provide a tuning range of about 3 MHz to about 6 MHz, and that’s exactly what it does.  I also bought some cheap RG174 coax for the coupling loop, and used some AWG 16 primary wire that I already had in my junk box for the magnetic loop.

The form for the magnetic loop is a 12-inch bamboo embroidery hoop from Michaels.  Thought not strictly required, I found it made it easier to keep the magnetic loop neat and well aligned.

Other parts came from Home Depot: a 1-gang stainless steel outlet box with 1/2-inch knockouts and a blank steel cover, a bag of plastic cable push-through plugs, and a bag of aluminum knock-out plugs.   I used the push-through plugs as bushings for the mag loop wires and coax to enter the outlet box.  In one knock-out plug, I drilled a 3/8-inch hole with a stepper bit to hold the BNC connector.  This I plugged into the bottom knock-out.

I had quite a lot of trouble working with the RG174 coax getting it soldered into a nice N4SPP Faraday loop (type 3 from his docs).  The next time I work on the coupling loop (if I need to again) I’ll use the same RG316 used by NA6O.  I found that it was easier to solder the far end to the exposed shield on the near end of the loop by stripping back about half an inch of the outer jacket, also stripping almost half an inch of the inner dielectric, exposing the center conductor for almost the entire length, cutting back the braid to about a quarter inch long, and the first soldering the braid to the center conductor.  Then I soldered just the center conductor to the exposed shield on the near end of the loop.  This required much less heat and much less time to solder than trying to solder braid-to-braid, and works just as well.

I drilled out holes in the cover plate to accommodate the Polyvaricon and its screws, hooked everything up, attached it to the SWR meter and got … nothing.  After some troubleshooting, I found that I’d missed a connection between the resonant loop, Polyvaricon, and the chassis.  Though the document describes connecting the stator to the chassis, I found that in the case of the Polyvaricon I had, I needed to connect the rotor pin to the chassis; the rotor pin is the one that connects to the knob with my Polyvaricon, and otherwise any time the rotor got close enough to the cover plate, I’d lose all sensitivity from the build.  So pay attention to how the connections work on your tuning capacitor, you may need to pick either the stator or the rotor depending on the configuration.

(Speaking of which, there’s no pinout included with the Polyvaricons I got on Amazon, so if you use these, fold out all the pins, then find the side with 5 pins, one of which is in the center halfway up.  With the knob side on the top, the two pins on the top row are your stators, and the pin in the center is the rotor.  You can snip all the other pins.)

I was never able to get anything remotely close to the SWR described in the original document, but I strongly suspect this comes down to two things: coupling loop size, and the super cheap coax that I bought – it may not even be properly 50 ohms.  I do, however, get a nice sharp dip in SWR where the antenna is resonant, and it’s more than good enough for DF work.  Some day when I run out of other things to do, it may be fun to play with the coupling loop size to try to get a better match.

I also sourced a used, inexpensive, battery-operated shortwave radio, a Tecsun PL-330, and a pigtail to convert between BNC and the 3.5mm TS jack the Tecsun uses for an external antenna.  As an unexpected bonus, the Tecsun PL-330 also gives you a dBu reading of the received signal, which is really handy when direction finding.  You don’t need to rely solely on your ears.   I found that it still seems to use the built-in antenna when an external antenna is connected, which can confuse things when hunting, so I removed the screw holding the telescoping whip and removed the whip antenna entirely.

In the first field test of the antenna, I was able to quickly discern one of my “usual suspect” poles, and when turning the antenna null in the direction of the pole, the null was deep enough that I could hear WWV clearly on 5 MHz.  Being only a degree or two off was enough to bring the powerline buzz back.  I also found that because the intensity with some of these poles is so high, going up in frequency some to 5 MHz (rather than my monitor frequency of 3.540 MHz) helped avoid overloading the shortwave receiver — at 3.5 MHz, the signal is so strong that it even gets picked up with the null facing the source, maybe due to some diffraction, maybe just the internal wiring of the radio still receiving such a strong signal regardless of the antenna.

In any case, if you have the time, this is a great device to have in your arsenal for direction-finding powerline RFI.  I think the total cost of the project, excluding some tools I bought myself to make a few things easier, came up well under $50.
N6OL Powerline QRM Monitor Now Publicly Available

For the last two years, here at N6OL I’ve been running some custom powerline QRM monitoring software.  If you’ve read my old blog posts you’ve probably seen screen shots or references to the monitor or the charts it produces.

I’m pleased to say that with the help of Claude Code, I’ve finally had a chance to sit down and refactor the code into something less hackish, better organized, better documented, and generally possible for someone other than myself to be able to use.  (The original was kind of held together with duct tape and chewing gum, was all just one gigantic hacked-together single class monstrosity that sort of evolved over time into something that basically worked but was inelegant and below my standards.)

The project can be found at https://github.com/spatula75/n6ol-powerline-qrm-monitor

Setting it up requires some command-line work, configuration file editing, and familiarity with Python basics, all of which is covered in the README.md file.  So make sure you follow along in the README if you want to be successful.

And before anyone is tempted to say “HURRR DURRR VIBE CODING SLOP DERP DERP DERP” just don’t.  This code was primarily already written by hand, by me, starting back in 2024, and was originally expected to be just some throwaway script that I’d stop running as soon as PG&E finally fixed their crap.  I wasn’t expecting to still be here, two years later, with PG&E having done next-to-nothing to solve their FCC-regulation-violating behavior.  What Claude Code mostly did for me was a guided refactor into modules and classes, and then I got it to also write two small scripts to help with setup.  Other than that, the code is mostly original, human-produced code, with many hours of trial and error behind it.

The code has been tested and verified on a Windows environment, but conceptually should work on Linux, MacOS, and FreeBSD without much ado. You’re on your own if you want to use it in one of those environments, but I will gratefully accept PRs if you need to tweak something to get it working for one of those operating systems.  Just make sure you add tests where applicable so the code coverage doesn’t drop.

Video Evidence of PG&E’s Irresponsibility

I’ve been slow to post this update, because for a while, it looked like PG&E might actually have shown an interest in identifying the origin of the RFI that has plagued my neighborhood for the last two years, and I was cautiously optimistic that their intentions were honest and sincere. My optimism was misplaced.

What they were actually doing was making an effort to locate anything they could in my neighborhood that they could blame for the RFI, other than  their own equipment.  They settled on a cable TV amplifier.  I, of course, did my due diligence and pointed a Yagi at the amplifier in question, and while it is putting out a small amount of RFI, it manifests as a high-frequency sine wave, not as a 120-pulse-per-second buzz.

So I set out to do, again, what PG&E has failed to do for the last two years: I located the source for them.  This time, I recorded the entire noise hunt on video so the whole world can see just how easy it is to track down, and how there’s simply no way that PG&E’s inability to find this source could be attributed to simple incompetence.  A child could find a noise source this obvious.  PG&E has much nicer equipment at their disposal than I do.  They could easily find this problem if they wanted to.

Here’s the entire noise hunt, captured on video, for the whole world to see.  This is what PG&E won’t do.  Not out of incompetence- incompetence cannot explain this behavior.  You’d need to be actively trying not to find this noise in order not to find it.

It’s been said both “don’t ascribe to malice that which can be explained with incompetence” and “any sufficiently advanced form of incompetence is indiscernible from malice.”  I propose another adage: any sufficiently advanced form of malice need not be explained by incompetence.

Enjoy:

No, really, it is you:

Apologies for the rough nature of the video. I plan to make up something a lot nicer aimed at a wider audience. I just put this together over the last couple days to demonstrate, again, where this noise is coming from (I’ve performed this same triangulation many, many times over the last few years.)

In an effort to better track the noise, back in 2024 I wrote some custom monitoring software which cross-correlates the audio from 3.540 MHz with 120pps noise and charts it relative to the noise floor once per minute, 24×7.

The video begins on the evening of March 26, 2026, when the monitoring chart showed a strong 120pps noise. I then set out to a nearby trail with a clear view of the substation with my 70cm Yagi and HT set to 440 MHz, AM mode. I chose two locations near the creek and recorded myself looking for the strongest “buzz” from the HT. I tried to find the strongest buzz from each of these two locations, and did a circle to verify that the signal was not actually coming from behind me or from a side lobe. (Hopefully nobody gets dizzy watching that part.)

It’s not enough to only look when there’s known to be an active noise source, however. It’s also necessary to check that when the monitor is showing no noise that observation with the directional antenna also shows no noise. So early this morning, while the chart showed no noise had started up yet, I set out again, and this is the final location clip in the video. I didn’t bother checking both locations, because there was no noise received (so there’d be nothing to triangulate).

PG&E has been playing games in recent weeks, specifically Occam’s Knife Game, in which they’re stabbing around, trying to blame everything they can possibly dream up except the obvious, glaring answer, which is the same answer it has been for the last two years.  It’s not somebody’s solar panels down the street (it happens at night too).  It’s not spurious emissions from a cable TV amplifier (the wrong kind of noise entirely).  It’s exactly what it appears to be at face value, and exactly the source that PG&E’s own technicians found in March of 2025.  Everyone can see it with their own eyes.

« Older posts

© 2026 N6OL

Theme by Anders NorenUp ↑